Visualizations
The TUI provides real-time insight into training:
- Live Snake board
- High score tracking
- Score plots
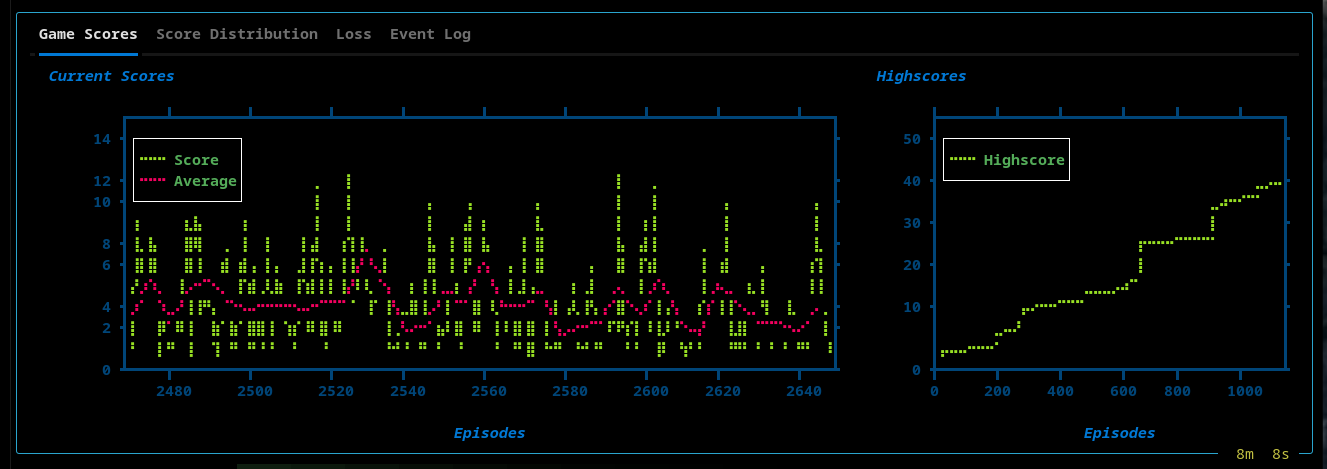
Views include:
High Scores, Current and Average Current Scores
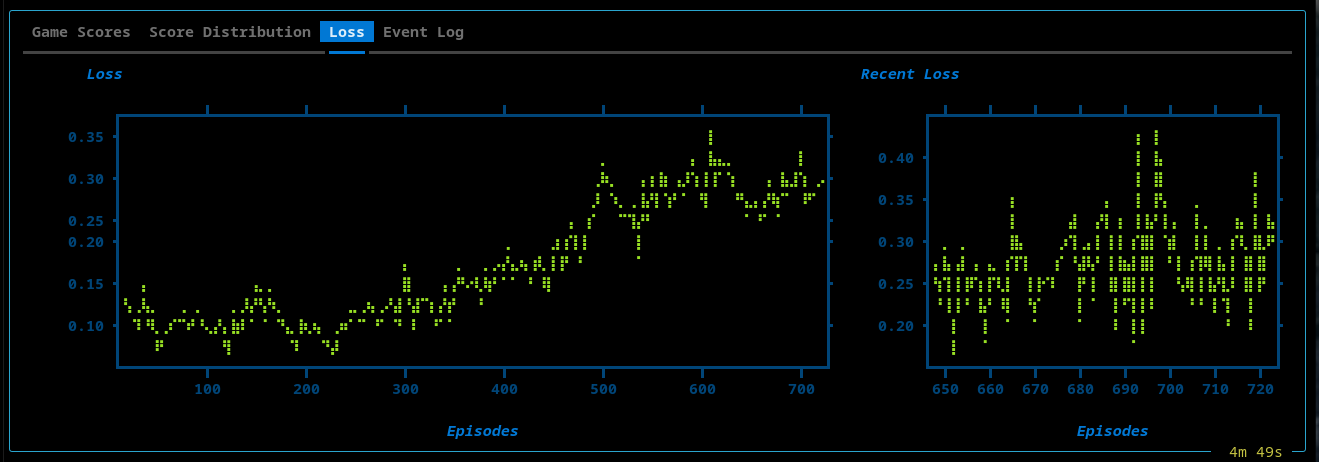
Loss
- Full training loss over time
- Sliding window (recent 75 episodes)
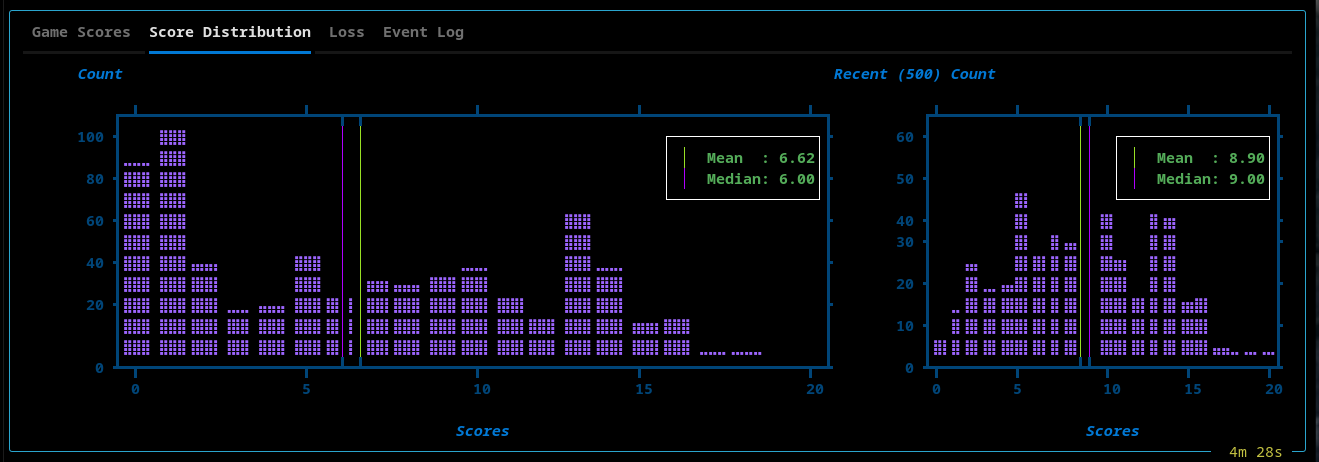
Scores Distribution
- Global score histogram
- Recent performance window (last 500 episodes)
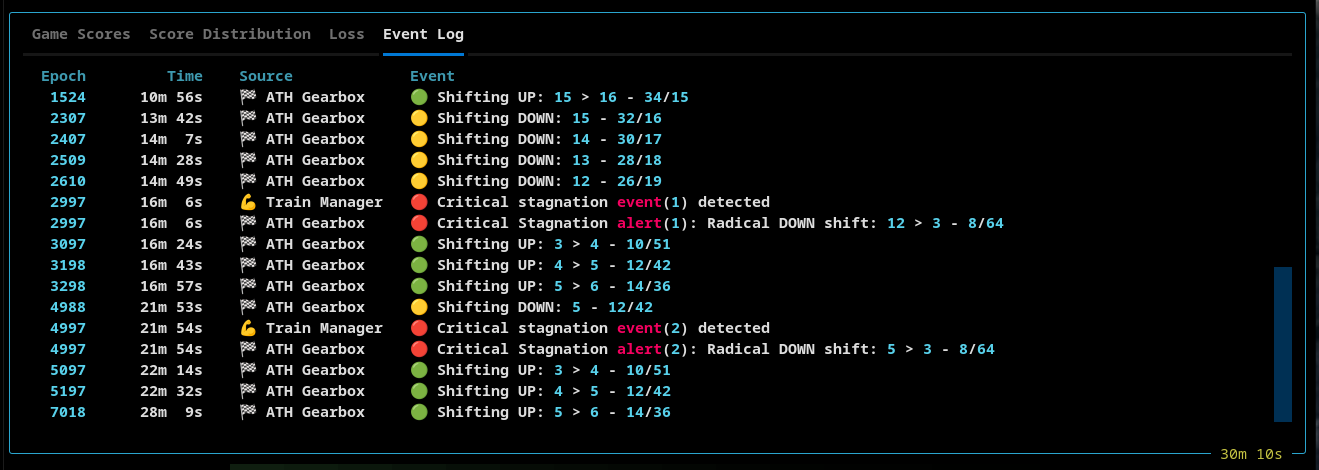
Event Log
A structured event stream capturing system behavior:
- Simulation lifecycle
- Replay memory transitions
- Gear shifts and thresholds